Creating Composite Spectra
Here we outline how to generate composite spectra using the methods of Siebert et al. 2019. Start by defining query_list such that it describes the subset of data that for which you wish to generate a composite spectrum. Then run the make_composite:
query_list = ["SELECT * from Spectra inner join Events ON Spectra.SN = Events.SN where phase >= -1 and phase <= 1 and ((dm15_source < 1.8) or (dm15_from_fits < 1.8))"]
composites, sn_arrays, boot_sn_arrays = kpora.make_composite(query_list, boot=False, medmean=1, verbose=False, gini_balance=True, combine=True)
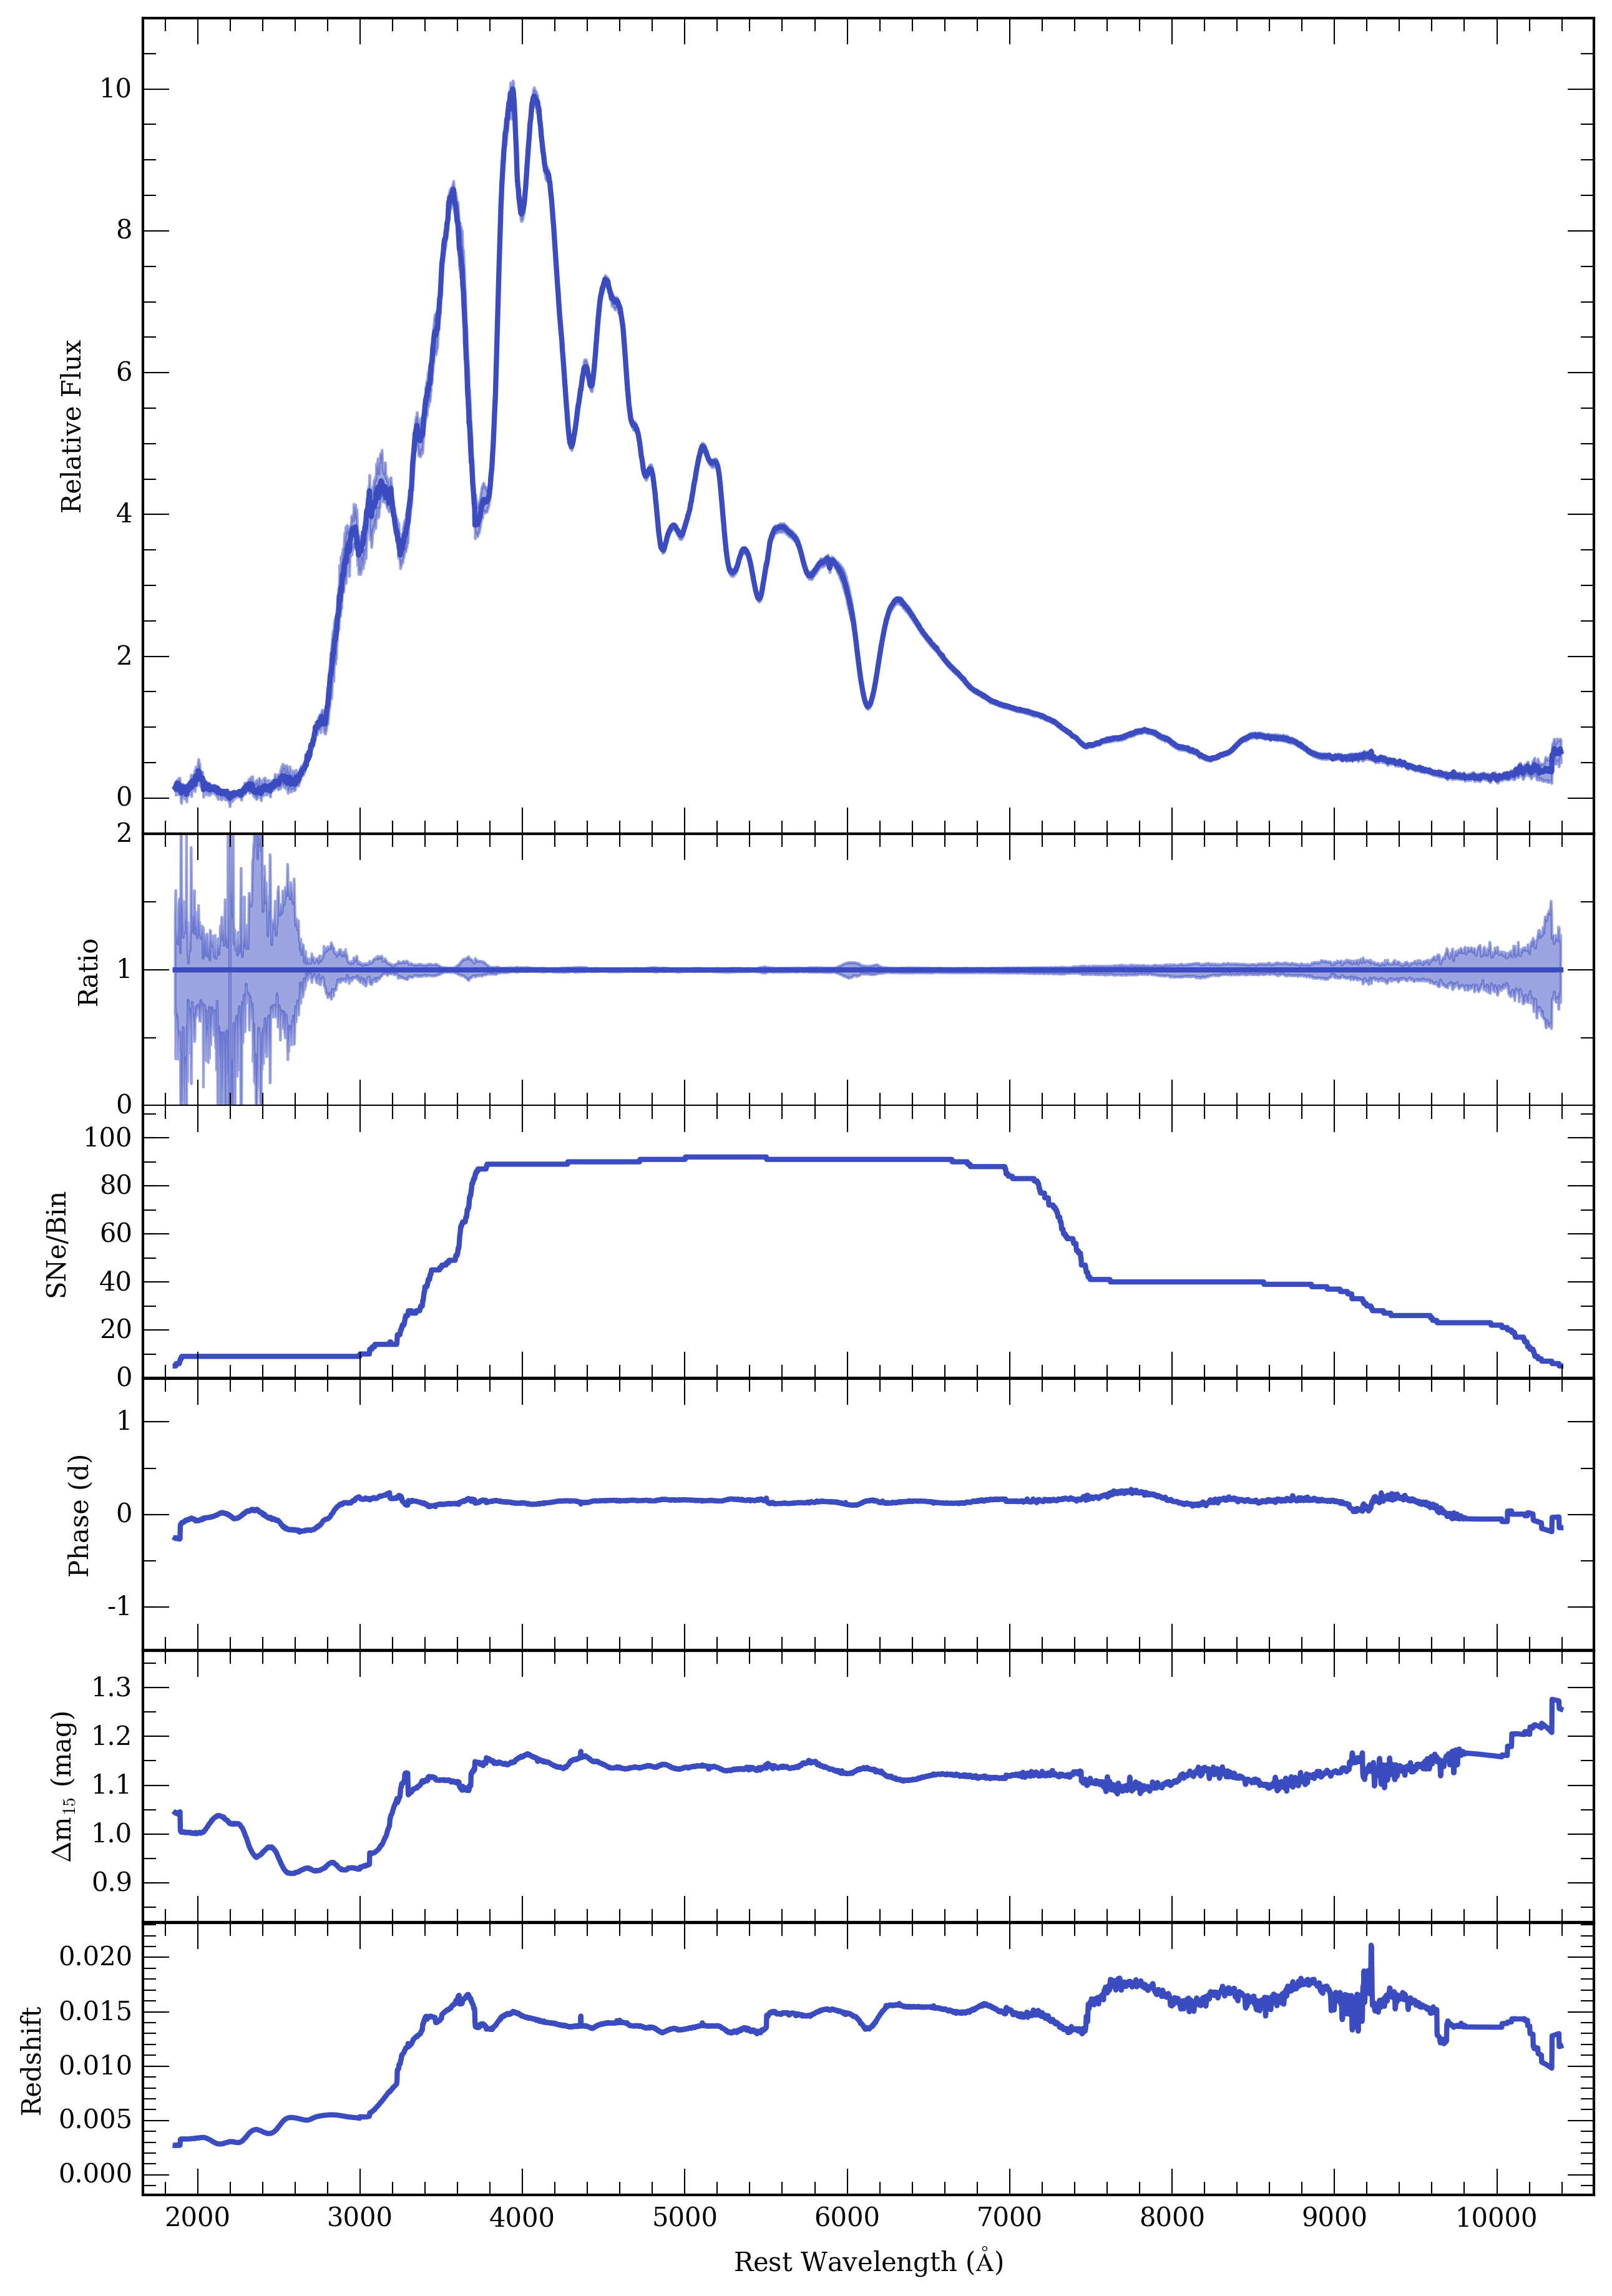
This will generate a composite spectrum for each query in query_list and will take of order seconds to minutes depending on the size of the sample. A composite spectrum is a spectrum object that contains a few more attributes. phase_array, dm15_array, and red_array contain the weighted averages of phase, dm15, and redshift as a function of wavelength. sn_arrays contains the list of combined spectrum objects used to construct the composite spectrum.
Other applications of the available make_composite arguments are listed below
boot = True: estimate the 1-sigma confidence intervals via 100 random resamples of the spectra (this significantly increases computation time). This will populate the low_conf and up_conf attributes of the composites spectrum objects. This also populates boot_sn_arrays with a list of composite spectra generated from these resamples.
medmean = 2: a median composite spectrum will be generated.
verbose = True: prints basic information about each spectrum contributing to the composite spectrum.
gini_balance = False: does an inverse-variance weighted average of the original data (this is more susceptible to high SNR outliers). For more information on our Gini-weighting method please read our paper.
combine = False: does not initially combine spectra from the same SNe.
We also provide a useful plotting function to visualize your composite spectra. This will also output the average properties of the composite spectra within wavelength ranges defined by set_min_num_spec.
import kaepora_plot as kplot
kpora.set_min_num_spec(composites, 5)
kplot.comparison_plot(composites, min_num_show=5)